SignalIQ Event Indicators
The SignalIQ plug-in enables chart users to incorporate visual signals highlighting event occurrences in their technical analysis. Unlike alerts, which appear only when they occur and don’t stay on the chart for users to view, SignalIQ uses chart markers and paintbars to display events, which allows users to add signals for historical evaluation as well as ongoing analysis.

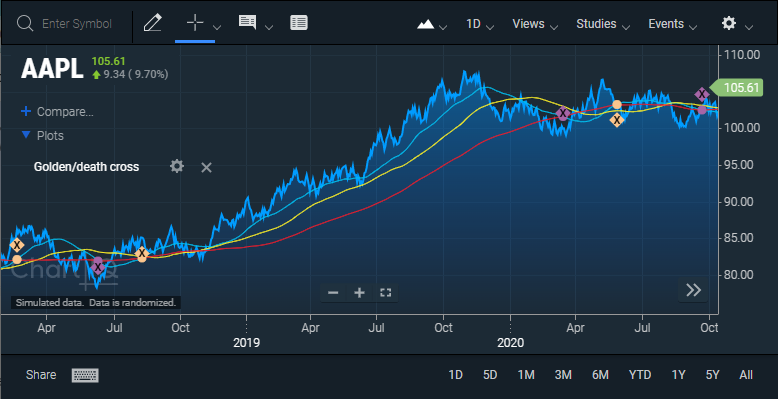
Figure. Chart events appear as diamonds on the chart and circles on the Moving Average Cross study. Gold markers show golden crosses (i.e., 50MA (blue) crosses above the 200MA (red)) and purple markers show death crosses (i.e., 50MA crosses below the 200MA).
Signal indicators
There are two types of indicators available for signalling event occurrences: chart markers and paintbars.
-
Chart marker — appears as a circle, diamond, or square to indicate when a signal occurs. Shape color is user-selectable via a color picker and can include a single-character label. Clicking a marker opens the related study panel or shows/hides the study if it is on the primary series (see previous chart).
-
Paintbar — adds a non-clickable, user-selectable color to the primary series when a signal event occurs. Unlike chart markers, only one paintbar will display on any given bar. As such, if multiple signals target the same bar, the paintbar color for the last signal applied on that bar will be visible. Care should be taken to enter signals in the order in which they should be layered on the chart.
Example
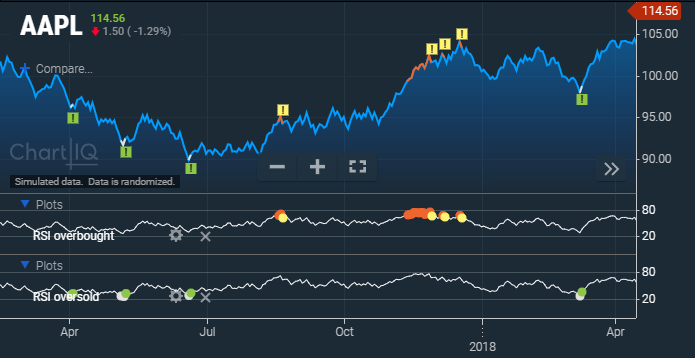
The following image shows two signals: one for RSI overbought and the other for RSI oversold. Signal chart markers appear as squares on the primary series and circles on the RSI study. Green markers appear when RSI crosses above 30, indicating the stock is coming out of an oversold condition. Yellow markers appear when RSI crosses below 70, indicating the stock is coming out of an overbought condition. The gray and orange paintbars show periods in oversold and overbought conditions respectively.

Figure. Signals for RSI overbought and oversold conditions. Panels containing the underlying studies can be shown/hidden by clicking a marker.
Prerequisites
ChartIQ library version 8.6.0 or later.
Implementation
SignalIQ is implemented in the sample-template-advanced.html template, which is a full-featured charting application with an extensive user interface. The template is located in the root folder of your ChartIQ library.
The following import statements add the plug-in to the template:
import "./plugins/signaliq/signaliqDialog.js";
import "./plugins/signaliq/signaliq-marker.js";
If you are using your own template, be sure to include these imports.
Source files
The plug-in is contained in the plugins/signaliq folder of the charting library. The folder contains the JavaScript and CSS files that define the form and functionality of the plug-in.
-
CIQ.SignalIQ — class defined in signaliq.js. It includes the config object and the primary namespaces, members, methods, and type definitions that make up the plug-in. The file is imported into both signaliqDialog.js and signaliq-marker.js.
-
WebComponents.cq-signaliq-dialog — dialog web component defined in signaliqDialog.js. It displays a dialog so signal studies can be entered into the system through the UI.
-
CIQ.SignalIQ.Marker — chart marker defined in signaliq-marker.js. It creates an alert as a marker on the chart.
-
CIQ.SignalIQ.Paintbar — chart paintbar defined in signaliq-paintbar.js. It represents painting a bar on a time series chart.
-
signaliqDialog.css and signaliq-marker.css — style sheets that support the look and feel of the dialog web component and chart marker respectively.
Configuration
SignalIQ has the following configurable properties:
panelHeight— sets the default height of the study panel when added. Default value is80.displayCondition— an optional boolean that specifies whether to display the condition that triggered a signal event in the expanded tooltip. Default value isfalse.
To configure the plug-in properties, customize the default configuration in your template by setting the values of the parameters of the signalIQ property of the plugins object referenced by the configuration object returned from defaultConfiguration.js, for example:
import getDefaultConfig from "./js/defaultConfiguration.js";

const config = getDefaultConfig({
	markerSample: marker.MarkersSample,
	scrollStyle: PerfectScrollbar,
	quoteFeed: quotefeed,
	forecastQuoteFeed: forecastfeed,
	nameValueStore: CIQ.NameValueStore
});

config.plugins.signaliq.panelHeight = 150;
config.plugins.signaliq.displayCondition = true;
Refer to Chart Configuration for more information.
User interface
-
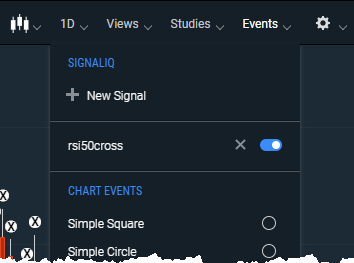
SignalIQ section on Events menu — enables users to add, edit, delete, and show/hide signals.

Figure. SignalIQ section of Events menu. -
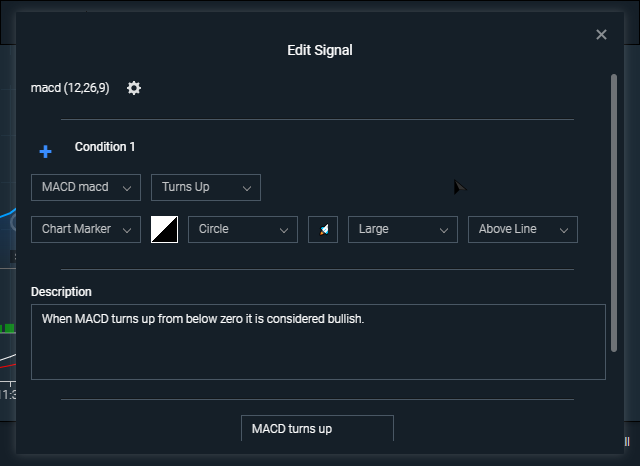
Signal dialog — enables users to choose studies, define event rules, and choose the appearance of event markers.

Figure. New Signal dialog.
Customization
SignalIQ graphical components are plain HTML. As such, they can be modified as desired. The JavaScript code for SignalIQ references these objects by class name and expects the components to exist. However, it makes no restriction on how they look. You can apply CSS selectors to override color or layout. You can also add or remove HTML componentry. For instance, if you require a disclaimer, simply add the disclaimer text to the HTML components.
Including additional JavaScript files
The SignalIQ plug-in is dynamically loaded. If you wish to load additional custom JavaScript files to support SignalIQ, you must load them before creating the SignalIQ instance. The best place to do this is by including the script files right after importing signaliq-marker.js.
